Running Analysis
The three most common analyses include batch analysis, comparative analysis (also known as plusminus analysis), and transfer curve analysis. All three of these analyses can be executed using the Excel Interface or tutorial Matlab scripts.
Batch Analysis
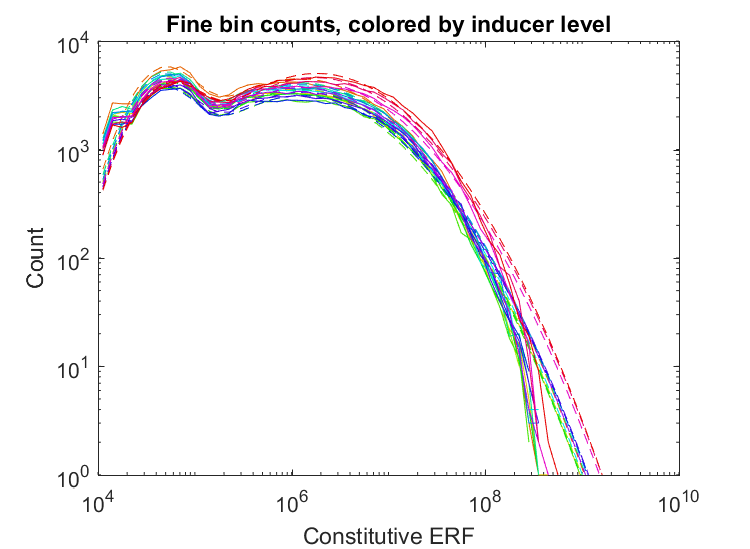
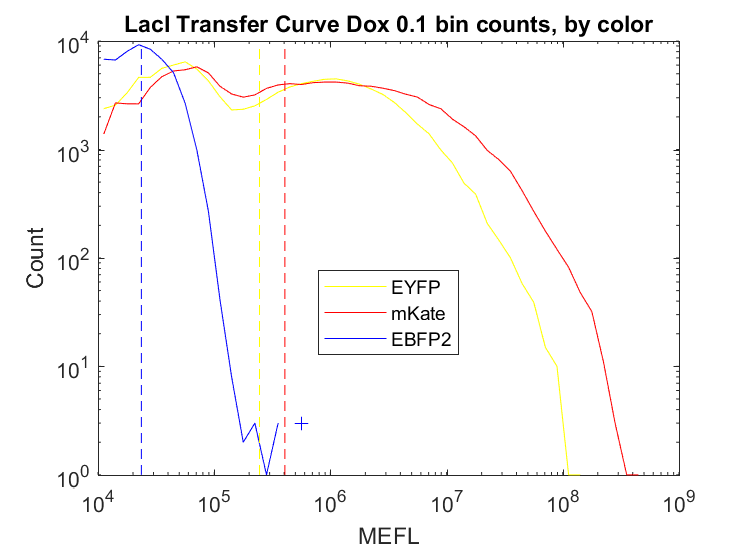
Batch analysis is the most basic analysis. It analyzes sets of replicates independently, outputting statistic files (containing geometric means and standard deviations) and graphs of bin counts for each channel in each sample.
Comparative Analysis
Comparative analysis compares data between various experimental conditions (i.e plus, minus). It plots these comparisons using many different methods, including ratios and fraction of cells active.
Transfer Curve Analysis
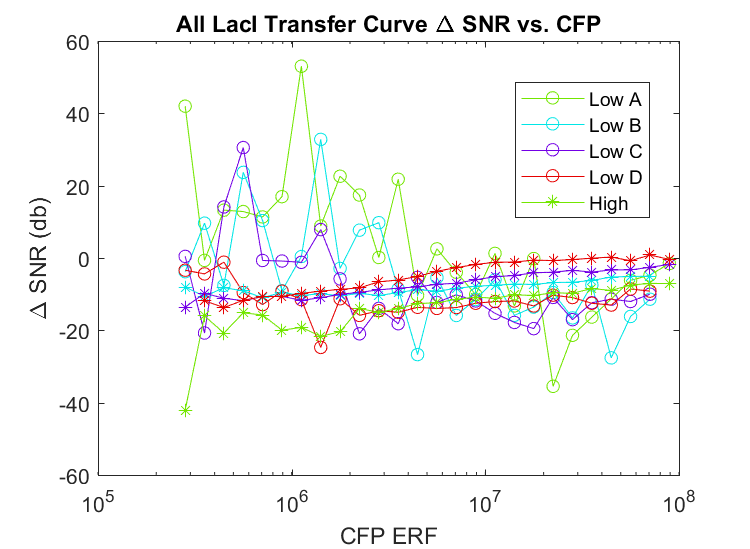
Transfer curves are created by varying an input and comparing it to an output. Transfer curve analysis plots transfer curves with numeric inducer values on the x-axis and input/output fluorescence on the y-axis.